

How do you know when the price is “right”?
In our hypothetical markets for watermelons and smoothies, equilibrium was restored by adjusting prices, thereby changing the quantity demanded and the quantity supplied in those markets. On a graph, a change in quantity demanded is shown as a movement from one point to another along the demand curve. Similarly, a change in quantity supplied is shown as a movement from one point to another along the supply curve. When quantity demanded and quantity supplied move to the same point — the intersection of the curves — equilibrium is reached.
Suppose, though, that instead of changes in quantity demanded and quantity supplied, a market experiences a change in demand or supply. Such a change would shift the entire demand or supply curve to a new position on the graph. This shift, in turn, would have an effect on market equilibrium.
Anything that brings about a shift in the demand curve is a demand shifter. Loss of income, a spike in the population, a popular new fad — any of these events could shift demand by altering consumer spending patterns. Likewise, anything that shifts the supply curve is a supply shifter. Important supply shifters include changes in the number of producers and changes in the cost of inputs.
When an event causes the demand or supply curve to shift, the point of equilibrium changes. To analyze such a change, economists ask these three questions:
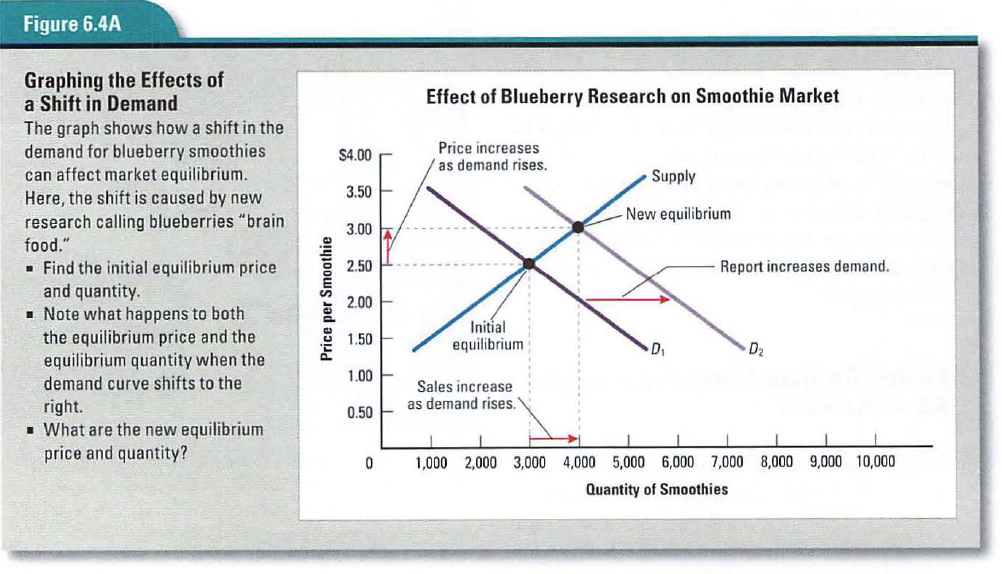
One of the most powerful factors that can influence market demand is changing consumer tastes. Consider, for example, what might happen if new medical research were to identify blueberries as a powerful “brain food.” How would this event affect the blueberry smoothie market? Think back to the three questions.
Does the event affect demand, supply, or both? The new research affects the demand for blueberry smoothies. After reading the published report, consumers buy more foods made with blueberries because they think eating blueberries will make them smarter. The research has little or no immediate impact on the supply of such products.
Does the event shift the demand or supply curve to the right or to the left? The event shifts the demand curve to the right. In Figure 6.4A, the demand for blueberry smoothies before the research was reported is represented by the initial demand curve, labeled D1. The demand after the report’s release is shown by the new curve, labeled D2 The D2 curve is to the right of the D1 curve. This shift to the right indicates an increase in demand.
What are the new equilibrium price and quantity, and how have they changed as a result of the event? Due to increased demand, the new equilibrium price — found at the intersection of the new demand curve and the supply curve — is $3.00. The new equilibrium quantity is 4,000 smoothies. This is an increase over the initial equilibrium price of $2.50 and equilibrium quantity of 3,000 smoothies.
Notice that if the juice bar owners had kept the price of smoothies at $2.50 after demand had increased, a shortage would have occurred. At $2.50, consumers would have demanded 5,000 smoothies, but the producers would have been willing and able to supply only 3,000. By raising the price to $3.00, the producers found the “right” price — the equilibrium price, at which the quantity demanded equals the quantity supplied.
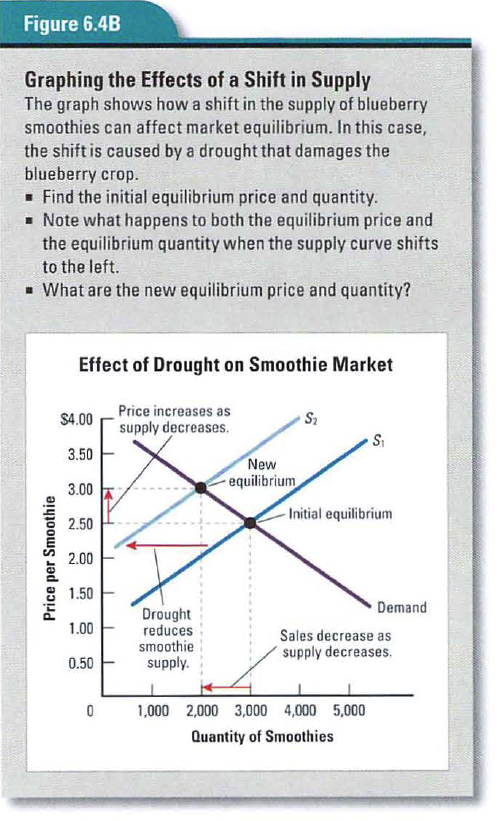
Among the many variables that can shift market supply are extreme weather conditions, such as hurricanes, floods, and freezing temperatures. Consider how a prolonged summer drought in major blueberry-producing states might affect the market for blueberry smoothies. Suppose the blueberry harvest is half of the average amount. What impact would this have on the market?
Does the event affect demand, supply, or both? The drought and subsequent bad harvest affect supply by driving up the cost of blueberries, one of the raw materials used in the production of blueberry smoothies. As a result of higher input costs, the juice bar owners supply fewer smoothies at every price. The drought has no impact on demand because the higher cost of blueberries does not change the number of smoothies people want to buy.
Does the event shift the demand or supply curve to the right or to the left? Because the number of smoothies produced has decreased at every price, the supply curve moves to the left. This is shown on the graph in Figure 6.4B. The new supply curve, labeled S2, is to the left of the initial supply curve, labeled S1.
What are the new equilibrium price and quantity, and how have they changed as a result of the event? The new equilibrium price for blueberry smoothies is $3.00. At this price, the new equilibrium quantity is 2,000 smoothies. Before the drought, the equilibrium price was $2.50 and the equilibrium quantity was 3,000 smoothies. The drought has caused the equilibrium price to increase and the equilibrium quantity to decrease.
If producers had not raised the price of smoothies, a shortage would have occurred. At $2.50, there would have been demand for 3,000 smoothies, but a supply of only 1,000. In other words, the price was no longer “right” at $2.50. At $3.00, the quantity of smoothies demanded and supplied became equal.
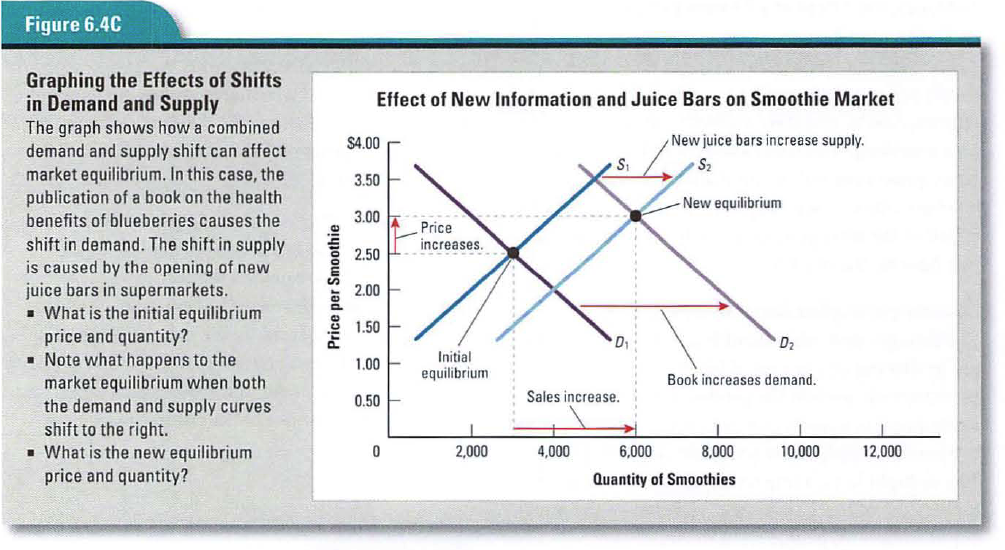
Finally, consider a scenario in which a combination of events causes changes in the demand and supply of blueberry smoot hies at the same time. The first event is the publication of a bestselling book that calls the blueberry “a miracle fruit” that promotes good health. The second event is the announcement by a supermarket chain that it is opening juice bars in most of its local stores. To determine the impact of these two events on the smoothie market, think again of the three questions.
Do the events affect demand, supply, or both? The events are likely to affect both demand and supply. The book, like the research report in the earlier scenario, motivates consumers to buy more blueberry smoothies, thus increasing the quantity demanded at all prices, The juice bars opening in supermarkets cause an increase in the number of producers., thus increasing the quantity of smoothies supplied at all prices.
Do the events shift the demand or supply curve to the right or to the left? Because these events cause an increase in both quantity demanded and quantity supplied at all prices, both the demand curve and the supply curve shift to the right. This is shown on the graph in Figure 6.4C. The new demand and supply curves, labeled S2 and D2, are to the right of the initial demand and supply curves, labeled S1 and D1. This indicates an increase in both demand and supply.
What are the new equilibrium price and quantity, and how have they changed as a result of the event? While both demand and supply have increased, demand for smoothies has increased even more than supply has. The graph in Figure 6.4C shows an increase of the equilibrium price from $2.50 to $3.00 and an increase of the equilibrium quantity from 3,000 to 6,000 smoothies. If the juice bar owners had not raised the price by 50¢, a shortage of 2,000 smoothies would have occurred.
In the real world, demand and supply are continually shifting in response to events. The impact of such shifts is not always immediately clear. It usually takes time for economists to discern the precise effects of demand and supply shifters on markets. When a product’s demand and supply both increase, economists are safe in predicting that the equilibrium quantity of that product will increase. But they can’t tell with any certainty how the equilibrium price will change. In our simplified model of a market, the equilibrium price increased. In a real market, the equilibrium price could increase, decrease, or stay the same.