

Why can't you always get what you want?
In 1719, approaching the somewhat advanced age of 60, Daniel Defoe published what would become one of the great classics of English literature: The Life and Strange Surprising Adventures of Robinson Crusoe. The novel tells the story of a sailor who spent 28 years marooned on a remote tropical island.
The tale may have been inspired by the true story of Alexander Selkirk, a Scottish sailor who was left on a small island off the coast of Chile by his shipmates in 1704. For the next four years and four months, Selkirk survived using whatever resources the island had to offer. He became, in essence, a one-person economy. This makes him the ideal subject for exploring an economic model used to measure what we gain and lose when we decide how to use the resources available to us.
The production possibilities frontier (PPF) is an economic model, in the form of a line graph, that shows how an economy might use its resources to produce two goods. The graph shows all possible combinations of those goods. that can be produced using the available resources and technology fully. It also helps us see the tradeoffs involved in devoting more resources to the production of one good or the other.
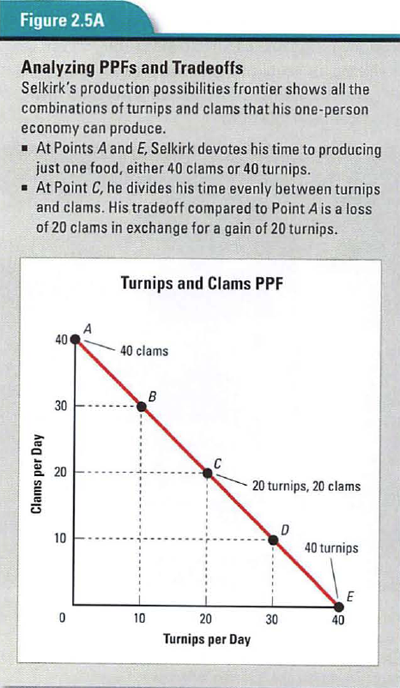
Figure 2.5A shows a PPF for Alexander Selkirk’s one-person economy. It focuses on the production of two foods that were critical to his survival: clams and wild turnips. In this hypothetical example, Selkirk can use the four hours he spends each day gathering food to harvest either turnips or clams. Using his crude digging stick, he can dig up an average of 10 turnips an hour in the forest or 10 clams an hour on the beach.
The sloping line on the graph shows the various combinations of turnips and clams that Selkirk can produce in a day. That line, known as the production possibilities curve, is straight in this simple case. In the more complex example you will look at next, the line bows outward in a curve. This line is also called the production possibilities frontier because it represents the best that this economy can do with its current factors of production. Without better tools (capital) or more time devoted to food gathering (labor), Selkirk will never produce more than any combination of turnips and clams shown along the line graph.
A PPF can also be used to measure the opportunity costs of different production choices. Consider a hypothetical country that can use its resources to produce just two goods: cell phones or bananas. Its land can be used for cell phone factories, banana plantations, or some combination of both. Its workers can be trained to assemble phones, raise bananas, or both. Its capital goods consist of assembly-line equipment, farm machinery, or some of each.
The graphs in Figure 2.5B show the different production possibilities for this two-goods economy, depending on how the country’s resources are allocated. Notice the bowed-out shape of the curve in this PPF. This shape indicates that the tradeoffs in this economy are not the same at every point on the curve. As a result, the opportunity cost — what the country gives up — when choosing to produce more of either good changes as one moves along the curve.
Why would this be so? One reason might be that not all of the country’s land is equally well suited for bananas or factories. Banana trees planted on poor land may not produce well. Factories located far from cities may have difficulty finding workers.
Another reason might be that the country’s workers are not equally well trained for banana and cell phone production. Suppose the country decides to increase its output of bananas. To do so, it would have to move workers from its factories to its plantations. The factory workers would arrive at the plantations with very different skills (such as knowing how to assemble electronic components) than the experienced plantation workers. They would likely be less productive than workers who have been raising bananas for some time.
The production possibilities frontier can also help us see how efficient our choices are. Economic efficiency is the result of using resources in a way that produces the maximum amount of goods and services. Every point on the PPF represents an efficient use of resources to produce that combination of outputs.
But what if an economy does not use its resources situations efficiently — or wishes to produce more than is currently possible given its resources? Both of those are illustrated in the second graph of Figure 2.5B.
Every point in the shaded area inside the PPF those represents a less efficient, but still attainable, production possibility. This reduced efficiency might be the result of a natural disaster or of a slowdown in the economy and a rise in unemployment. Whatever within this shaded area, the economy is not functioning at full efficiency.
Every point outside the PPF represents an unattainable production possibility. The economy’s resources are already being used to the max to reach the points on the curve. Beyond those points, the economy cannot produce more without added resources or improvements in efficiency.
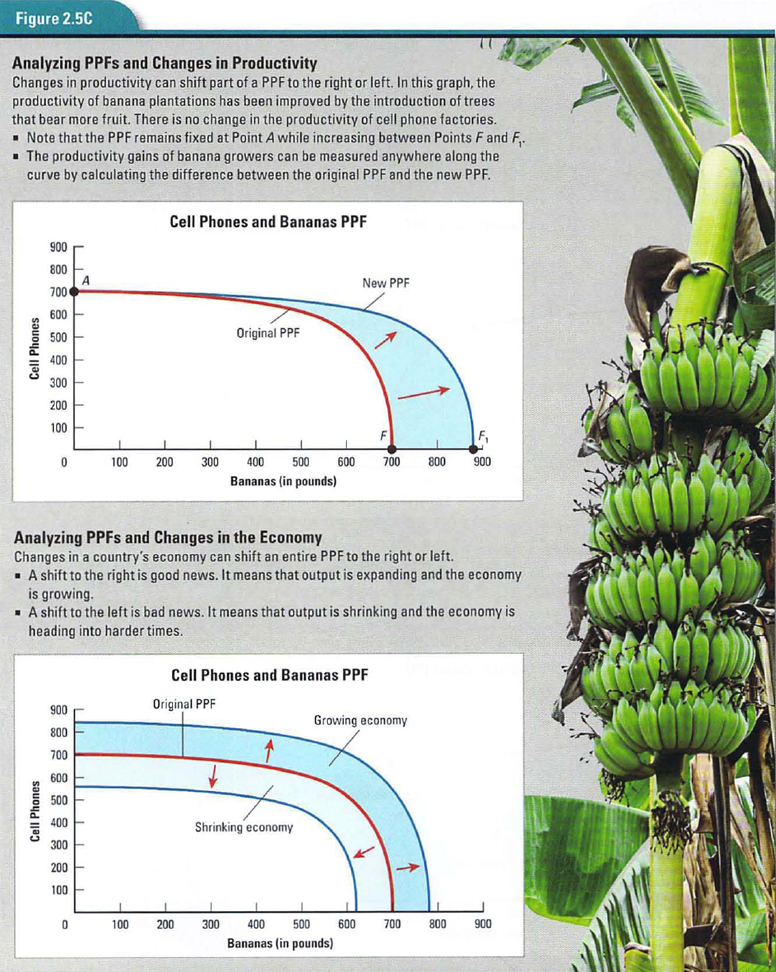
A PPF is a snapshot of an economy’s production possibilities at a specific moment in time. In the real world, these possibilities are constantly changing as economic conditions change. Improvements in productivity might mean more of one good can be produced using the same resources. Or the economy as a whole might expand or shrink. Both of these of situations are illustrated in Figure 2.5C.
When an economy grows, economists say that the PPF has “shifted to the right.” Productivity increases, the reason, jobs are more plentiful, and living standards improve. Likewise, when an economy shrinks, the PPF “shifts to the left.” Productivity falls, unemployment rises, and living standards decline. A number of factors can cause such shifts, many of which you will study in the chapters ahead.
What is important to remember at this point is that. while you can’t always have everything you want, the
decisions you make in life may influence what you get. The most important of those decisions, from an economic point of view, is how to maximize your human capital — and with that, your future earning power. You may never make enough money to get everything you want. But with enough human capital, you should be able, as the song says, to “get what you need.”