

What are demand and supply, and what factors influence them?
You no doubt already have a good idea of what elasticity means in the everyday world — rubber bands and bungee cords come immediately to mind. In the world of economics, elasticity retains this idea of “stretchiness.” Economists define elasticity as the degree to which a quantity demanded or a quantity supplied changes in response to a change in price. The degree of elasticity tells economists how responsive consumers and producers will be to a change in the price ofa good or service.
The economist Alfred Marshall first developed the idea that demand is elastic more than a century ago. He introduced the term elasticity to describe the way quantity demanded responds to changes in price. Economists since Marshall have referred to elasticity of demand as a measure of consumers’ sensitivity to a change in price. How sensitive are you to price changes? The answer most likely depends on what you want to buy. If the price of toothpaste were to increase by 50 percent, for example, you would probably buy it anyway. The demand for necessities like tooth paste tends to be inelastic, meaning that it responds slightly or not at all to a change in price.
In contrast, if your favorite energy bars were marked up by 50 percent, you might decide to buy something else instead. Your demand in this case would be elastic, or responsive to a change in price.
To an economist, the terms elastic and inelastic have precise mathematical definitions. To calculate the degree of elasticity of demand, economists use the following formula:
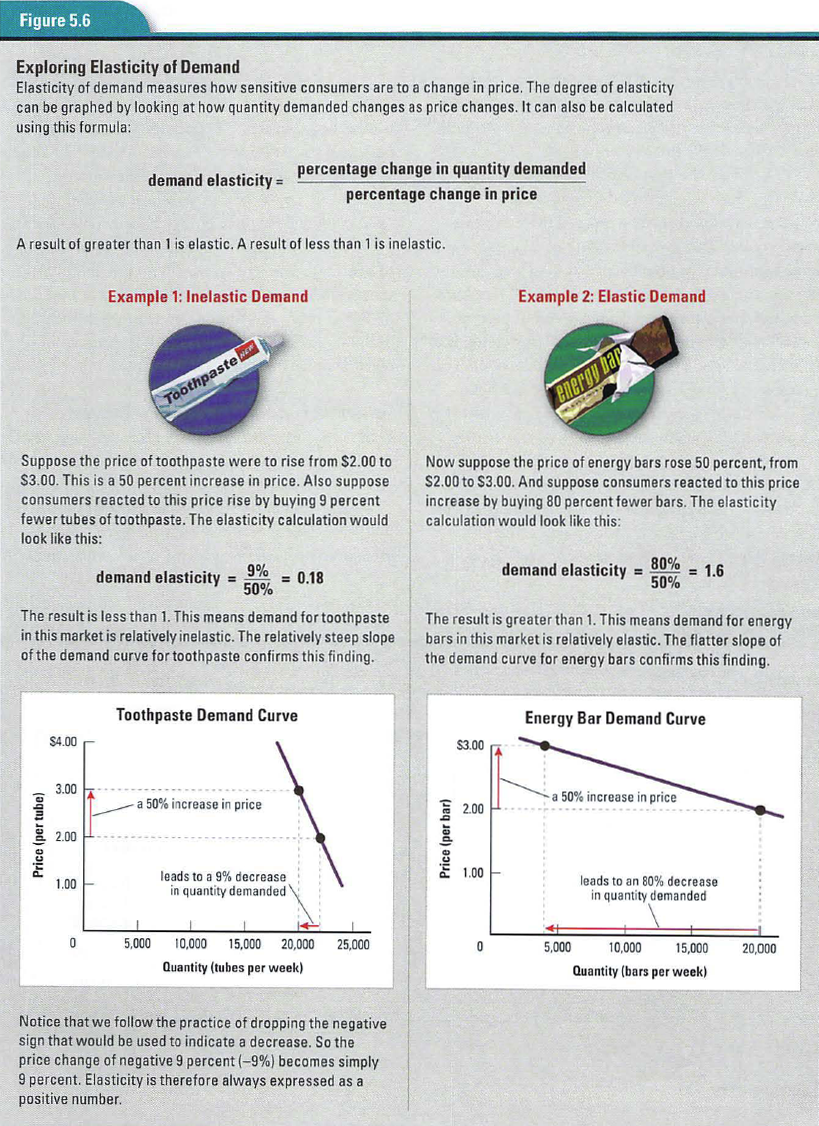
If the result of this calculation is greater than 1, demand is said to be elastic. If the result is less than 1, demand is inelastic. In Figure 5.6, you can see how these calculations work out for the toothpaste and energy bar examples you read about above.
Figure 5.6 also illustrates how elasticity can be graphed using a demand curve. The first graph shows a demand curve for toothpaste. A 50 percent increase in the price of toothpaste produces only a 10 percent decrease in the quantity demanded. The result is a demand curve with a steep slope. The quantity of toothpaste demanded moves only slightly along this steep curve when the price increases or decreases.
The second graph shows a demand curve for energy bars. Here, a 50 percent increase in price produces a 80 percent decrease in the quantity demanded. The result is demand curve with a flatter slope. The quantity of bars demanded moves much farther along this curve in response to price changes than is the case with toothpaste.
Economists use several terms to describe degrees of elasticity. I n addition to elastic and inelastic, the), speak of perfectly elastic, perfectly inelastic, and unitary elastic. Unitary elastic demand occurs when the percentage change in price exactly equals the percentage change in quantity demanded. The result of the elasticity calculation in such instances is exactly 1.
The only way to know for certain whether a demand curve is elastic or inelastic is to plug the percentages into the formula and do the math. But as a general rule of thumb, the flatter the curve, the more likely it is that demand is elastic. The steeper the curve, the more likely it is that demand is inelastic.
Knowing how elastic demand is for various goods can help producers price their products at a level that maximizes their revenue. To gauge the impact of prices on their revenue, producers use a business tool known as the total revenue test.
To measure the elasticity of demand for toothpaste, for example, a producer using the total revenue test would create a revenue table like those shown below. Like a market demand schedule. a revenue table lists the possible prices for a given product and the market demand at each price. But it has an additional column for total revenue at each price level. Total revenue is calculated by multiplying the quantity of a good sold by the price of the good. For example, a toothpaste producer who sells 22,000 tubes of toothpaste per week at $2.00 per tube earns a total revenue of S44,000 per week.
The revenue table for toothpaste shows that as the price of toothpaste increases, total revenue also increases. This response to price changes tells us that demand for toothpaste in this market is inelastic. Even a large change in price leads to a relatively small change in the quantity demanded. In this case, toothpaste producers can maximize their total revenue by selling fewer units at higher prices.
The revenue table for energy bars tells a different story. It shows that as the price of the bars increases, total revenue decreases. The demand for energy bars in this market is very elastic — a small change in price leads to a large change in the quantity demanded. This producer will earn a higher total revenue by selling more energy bars at lower prices.
Any producer thinking about changing the price ofa product needs to know whether demand for that product is inelastic or elastic. When demand is inelastic. price and total revenue move in the same direction. When demand is elastic, price and total revenue move in opposite directions.
Why is consumer demand more elastic for some goods than for others’ The following factors help economists predict the elasticity of demand for a good or service.
Availability of substitutes. Demand for products that have close substitutes tends to be elastic. If the price of a sports drink goes up, for example, many consumers will switch to bottled juice or water. Milk, however, has no close substitutes. When its price increases, most consumers of milk continue to buy it. Demand for milk is inelastic.
Price relative to income. Consumers are more responsive to changes in price when buying “big ticket” items, which eat up more income, than when making minor purchases. If you were considering buying a laptop computer, for example, a price decrease of 20 percent might very well motivate you to buy. Your demand in this case would be elastic. Your demand for an inexpensive item like soap, however, would be inelastic. You might not even notice if its price were to increase or decrease 20 percent.
Necessities versus luxuries. When a product is perceived as a necessity, demand for it tends to be highly inelastic. Demand for luxuries, in contrast, is elastic. People will always buy food, a necessity, even if prices increase. Luxuries like fancy watches, on the other hand, are goods we can live without. If their price goes up, we can easily stop buying them.
Time needed to adjust to a price change. Elasticity of demand can change over time. When gas prices increased sharply in 2011, many people found it difficult to reduce their gas consumption in response. They still needed gas to drive to work, shop, and get around. Nor could they instantly exchange their big gas guzzlers for more fuel-efficient vehicles. Over time, however, people adjusted to the price rise. They formed carpools, began using public transportation, and bought smaller cars that used less fuel. As they did so, the demand for gas gradually became more elastic.