

How can you think like an economist?
The law of unintended consequences illustrates just how complicated- and frustrating- the work of an economist can be. You might wonder why economists do not just throw up their hands and say, “I quit!” But economists actually like their job and enjoy solving economic enigmas.
To do their job properly, economists need ways to examine economic events, to simplify them, and to figure out how a given economic decision can affect the world. To do this, they need a set of tools. Three of the most effective tools that economists use are the scientific method, graphs, and economic models.
You are no doubt familiar with the first tool, which you probably began learning in elementary school. As shown below, the scientific method involves posing a question, researching the question, developing a hypothesis, conducting studies and collecting information, analyzing the information, and then evaluating the hypothesis. You may have applied the scientific method by growing bean plants, examining bacteria under a microscope, or measuring waves in a wave tank. Through such laboratory experiments, you collected data, or factual information, that gave you vital insights into the physical world and its processes.
Economists, like other scientists, rely on the scientific method to study how the world works. But they have a big handicap. Usually, they cannot conduct laboratory experiments to make observations or test their theories. For example, an economist. might have a theory that raising highway speed limits would improve the economy, in part by enabling the speedier transport of goods from farms and factories to stores. But how might she test that theory? It is highly unlikely that government officials would permit an economist to turn the highway system into a huge laboratory.
When economists lack experimental data, they have to be satisfied with whatever data society naturally provides. For this reason, economists have become skilled at analyzing existing and historical data. As it happens, a law that was passed in 1974 resulted in a national maximum speed limit of 55 miles per hour. In 1995, Congress repealed the law, allowing each state to set its own maximum speed. Many states raised their limits, giving economists the chance to analyze how transportation costs varied before and after the speed limit changed. Through such “natural experiments,” economists have learned what kinds of data are important and have developed ways to examine those data. As economist Steven Levitt noted, “Knowing what to measure and how to measure it makes a complicated world much less so.”
Graphs are useful tools for analyzing and displaying data. A graph is a visual representation of the relationship between two given sets of data. One or both sets of data are also known as variables. A variable is a quantity that can vary, or change. Economists use two-dimensional graphs to simplify the complex, three-dimensional world in which we live. Because it is, a simplification, a graph may not yield a complete picture of how two sets of information are related. Nonetheless, it gives economists an important tool for examining the relationship
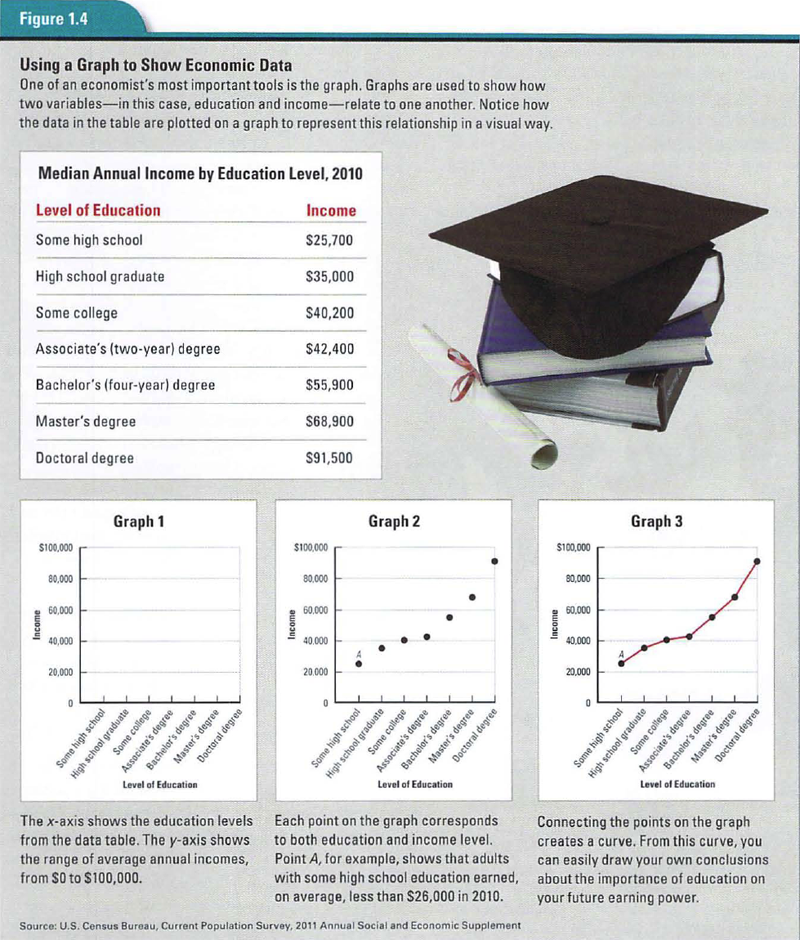
Consider how economists might analyze the relationship between the amount of education a person has and that person’s annual income. They would start by gathering information. The table in Figure 1.4 shows data for the year 2005. The two variables in this table are level of education and income. Each dollar figure in the table represents the average annual income of every person at that education level who had an income in 2005.
The same data can be plotted on a coordinate system, like the graphs shown with the table. A coordinate system consists of two perpendicular lines that can be used to locate a point in space. Each of the two perpendicular lines is called an axis. The horizontal line is the x-axis, and the vertical line is the y-axis.
Once the data in the table are plotted as a set of points in the coordinate system, the points can be joined to form a curve. A curve is any line representing data points plotted on a graph. As you can see in Graph 3 in Figure 1.4, a curve doesn’t have to be curved. In fact, straight lines on a graph are also called curves. The shape of this curve tells us that, on average, the more education people have, the higher their incomes will be.
As useful as graphs are at representing relationships, they have their limitations. The graphs in Figure 1.4 do not, for example, shed light on factors other than education that might have affected income in 2005. Suppose an unusually harsh winter had slowed construction projects and delayed spring planting across the country that year. The impact of such a slowdown would have fallen most heavily on construction workers and farmworkers, many of whom lack college degrees. As a result, their 2005 incomes would have been lower than usual for reasons quite unrelated to education.
Economists use models to help them understand how the world works. An economic model is a simplified representation of reality that often allows economists to focus on the effects of one change at a time. Models also help economists structure their thinking. A model can take the form of an equation, a computer program, or a diagram. It can also consist mainly of a written description.
One widely accepted descriptive model is called homo economicus. This is Latin for “economic man,” although it applies to all human beings. It is also called the rational-behavior model. This model is a tool for understanding the mystery of human behavior. It theorizes that people behave in ways that are rational, or based on reason. That is, people make decisions that they think will fulfill their wants and needs to the greatest extent possible. They behave in ways that serve their own interests, without taking into account the well-being of others.
The rational-behavior model, with its focus on self-interest, arose after the time of Adam Smith. But the pursuit of self-interest plays a key role in Smith’s descriptions of the free market. As if guided by an “invisible hand,” self-interested market activity ends up benefiting all of society. This is the point Smith made in describing the typical businessperson:
Models are an approximation of how people, in general, act. As such, models cannot accurately predict all behavior all of the time. Economists who construct models must make assumptions. Consider the model just described, which assumes that people always act for their own benefit. Economists know that the rational-behavior model does not deal with social values, such as charity, that might curb self-interest. Nor does it deal with decisions based on limited or false information.
Faced with these missing factors, the economist shrugs and says, “Ceteris paribus,” which is Latin for “other things being equal” or “other relevant factors remaining unchanged.” This is the economist’s way of saying, “Let’s focus on understanding what happens if we change one aspect of the mystery and keep all other aspects the same.” The economist thinks, “Maybe if I can understand this one aspect, I can begin to understand the larger mystery.” The point of economic models is to aid in examining economic effects, one change at a time, and in making predictions about the consequences of that change.
Good economic models are useful for both explaining and predicting how the economy operates. The rational-behavior model works pretty well at predicting how people generally react to incentives or how they use cost-benefit analyses to make decisions. By and large, we do these things without even consciously thinking about them. When this happens, we are behaving as this economic model would predict.
According to this model, humans make decisions based on their own best interests. So, is thinking like an economist in your best interest? Certainly it is, if it helps you make better decisions. You have had a brief introduction to the principles and tools that help economists look at the world in a special way. In the rest of this book, you will use those principles and tools to develop your own understanding of how the world works. In the process, you will become a better consumer and citizen. That seems like a pretty good tradeoff for the time you will spend in this course.