

What are demand and supply, and what factors influence them?
Opposite every consumer in a market exchange is a producer. Producers supply the goods and services that consumers demand. They decide what to supply and how much to produce. How do they make those decisions?
Price plays a critical role for producers, just as it does for consumers. Jasmine, for example, might be willing to sell a certain quantity of tacos for $2.00 apiece. But would she be willing to sell the same quantity at $1.00 apiece? Economists can safely predict that her answer would be no. The lower the price, the fewer tacos Jasmine would be willing to sell. This is a key idea in understanding the interaction between supply and price.
When we look at the supply side of the market, we find that the same concepts and terms that apply to consumers also apply to producers. The same ceteris paribus assumptions apply as well. All tacos are the same — and price, for now, is Jasmine’s only consideration. All other variables that might influence supply, including the cost of ingredients, are held constant.
Suppose, then, that a customer wants to buy as many tacos as Jasmine is willing to supply in a week for a big party, but she is only willing to supply 300 tacos at $\.00 apiece. Her profit at that price is so low that she is not interested in producing more. At a price of $3.00, however, she is willing to supply 500 tacos to the party giver. Each of these amounts is a quantity supplied. Quantity supplied is the amount of a good or service that producers are willing and able to offer for sale at a specific price.
When we add up the quantities that Jasmine and all other taco producers are willing and able to sell at all prices, the result is supply. Supply is the amount of a good or service that producers are willing and able to offer for sale at all prices in a given period. Like demand, supply is always expressed in terms of a specific time period, such as weeks or months.
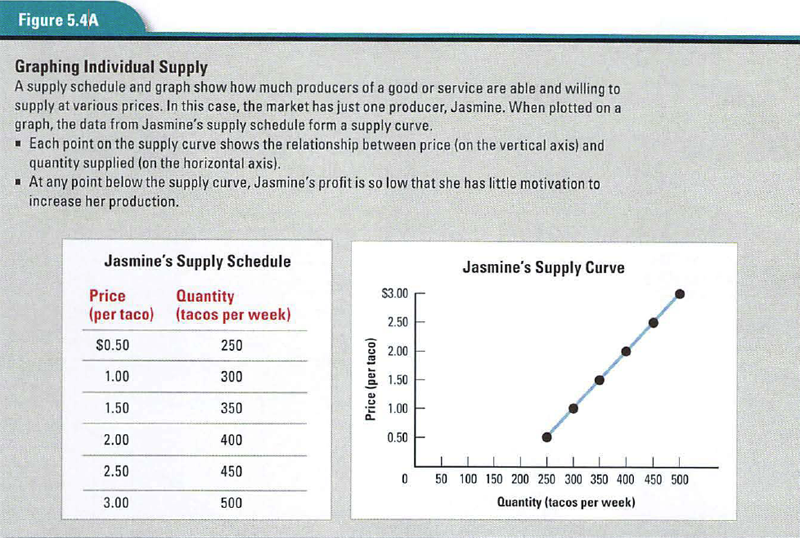
A look at Jasmine’s supply schedule can help us understand how price and supply interact. A supply schedule is a table that shows the quantities supplied at different prices in a market. The individual supply schedule in Figure 5.4A shows the quantities that Jasmine will supply at different prices. At a price of $2.00, for example, Jasmine’s quantity supplied is 400 tacos. In other words, she is willing and able to offer 400 tacos for sale per week at that price. Notice that as the price increases, the quantity of tacos that Jasmine is willing and able to offer for sale also increases.
The data from Jasmine’s supply schedule are plotted on the accompanying graph. Each pair of variables from the schedule — quantity and price — is a pair of coordinates marking a point on the graph. The line formed by connecting the points is a supply curve. A supply curve shows the relationship between the price and the quantity that producers are willing and able to supply. This supply curve shows that Jasmine will offer many more tacos for sale at a price of $3.00 each than she will at a price of $0.50 each.
Jasmine’s taqueria has thus far been operating in an imaginary one — producer market. A more realistic scenario would be a market with multiple producers, each one contributing to the market supply of tacos. Market supply is the sum of all the individual quantities supplied. When economists refer to supply, they are usually talking about market supply.
Economists studying markets have several methods of determining market supply. One is to keep track of production figures — how many goods each firm in a market is producing. Another is to survey firms to find out their quantities supplied at different prices.
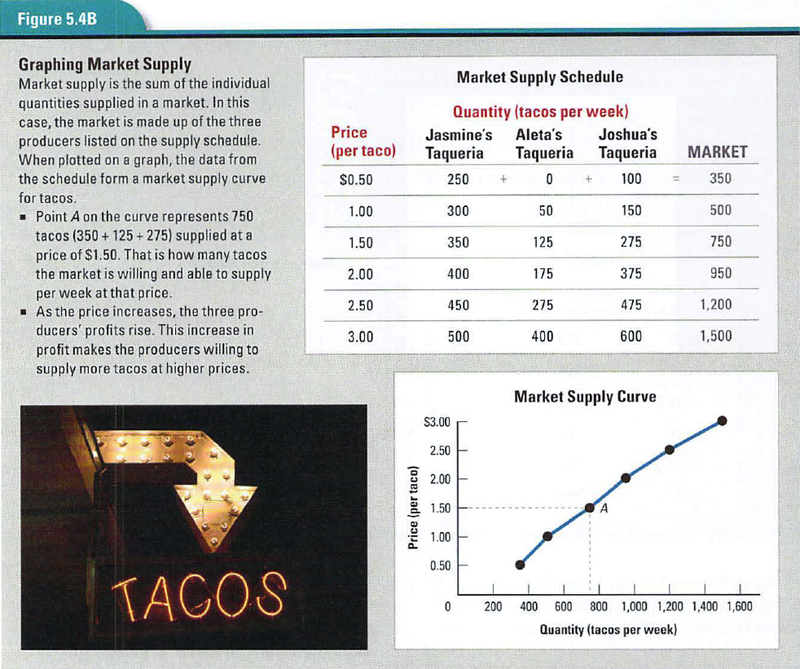
Suppose that Jasmine now has two competitors in the taco market: Aleta and Joshua. A survey of these three producers might result in the supply schedule shown in Figure 5.4B. The schedule shows each producer’s individual supply per week and the resulting total market supply.
The accompanying graph shows the same data as a market supply curve. Each point on the curve represents a quantity of tacos supplied at a given price. As you might expect, the graph shows a clear relationship between price and supply of tacos.
Jasmine’s supply curve and the market supply curve share an important similarity. In both, the quantity of tacos supplied increases as the price of tacos increases.
As the price decreases, the quantity supplied decreases. Price and quantity move in the same direction. Economists refer to this direct relationship between price and quantity as the law of supply. The law of supply holds true as long as all other influences on supply remain constant.
Why do price and quantity supplied move in the same direction? Economists cite two main reasons: production decisions by existing producers, and market entries and exits.
Production decisions by existing producers. In a market-based economy, every producer’s primary goal is to maximize profits. Firms earn profits based partly on revenue, the amount of money received in the course of doing business. Bringing in more revenue is likely to increase profits, so when prices increase, the desire to make a profit leads producers to increase their production of goods. They expect their profits to increase as a result. Likewise, when prices fall, producers are likely to cut production.
Market entries and exits. When the price of a good or service increases, new firms may enter a market because they see the potential for profit. For example, a building firm might enter the housing construction market to take advantage of rising home prices. Suppose the fi rm were to build 20 new homes and offer them for sale at $500,000 each. This would increase the quantity of houses supplied at that price. The reverse can also happen when prices drop. Producers may exit the market, decreasing the quantities supplied at certain prices.
The law of supply tells us that producers react in predictable ways to a change in the price of a good or service. As producers supply more at higher prices, and less at lower prices, the quantity supplied is said to “move along the supply curve.” Economists call this movement along the curve a change in quantity supplied. The only factor that causes a change in quantity supplied is price.